9 Mad Hats RTP and Technical Overview
9 Mad Hats utilises a conventional 5-reel, 3-row interface with 20 fixed paylines. The mathematical foundation provided by Triple Edge Studios offers a default Return to Player (RTP) of 96.24%, a figure marginally above the industry median. However, operators may utilise adjustable ranges, so verifying the specific percentage in the help file is advisable. Risk metrics indicate medium volatility, ensuring a balanced distribution of returns relative to the wager, which ranges from 0.20 to 60.00 credits.
The maximum theoretical payout is rigidly capped at 2,000x the total stake. This ceiling is tied directly to the instant scatter mechanics rather than progressive winning combinations. Experienced players will recognise the engine as a direct clone of the Gameburger '9 Masks' architecture, offering identical statistical probabilities and hit frequencies. The math model prioritises frequent, moderate wins via the scatter mechanic rather than extreme variance, making it suitable for systematic bankroll management.

Paytable and Symbol Analysis
The paytable hierarchy is established through low-value card suits and high-value numeric symbols. Diamonds, Clubs, Spades, and Hearts constitute the lower tier, offering returns between 1x and 3.25x the bet for five-of-a-kind combinations. The premium segment relies on variations of the Lucky 7; landing five Triple 7s yields 37.5x the stake, while Double 7s and Single 7s pay significantly less. Mixed combinations of any 7s are permitted, providing smaller returns of 3.25x for a full line.
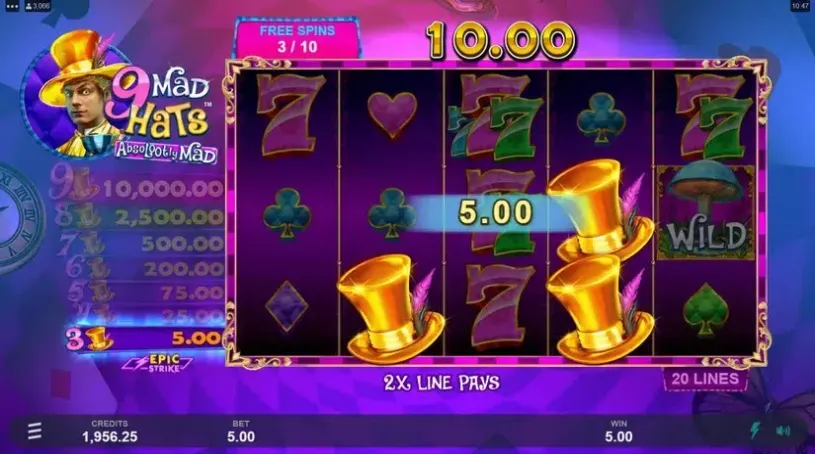
The Mushroom Wild is the most valuable symbol on the grid, substituting for all regular icons and paying 125x for a complete payline. Conversely, the Golden Hat symbol operates outside standard paylines as the Epic Strike scatter. It requires a minimum of three instances to trigger a payout, scaling exponentially based on the volume of symbols visible on the screen. The Free Spin scatter appears exclusively on reels 2, 3, and 4, paying 1x the bet upfront.
Symbol Payouts
| Symbol | Payout |
|---|---|
 | Wild |
| 5 → x125 | |
| 4 → x25 | |
| 3 → x6.25 | |
 | 5 → x37.5 |
| 4 → x16.25 | |
| 3 → x2.5 | |
 | 5 → x20 |
| 4 → x6.25 | |
| 3 → x1.25 | |
 | 5 → x7.5 |
| 4 → x3.75 | |
| 3 → x1 | |
 | 5 → x3.25 |
| 4 → x1 | |
| 3 → x0.5 | |
 | 5 → x2 |
| 4 → x0.75 | |
| 3 → x0.25 | |
 | 5 → x1 |
| 4 → x0.4 | |
| 3 → x0.25 | |
 | 5 → x1 |
| 4 → x0.4 | |
| 3 → x0.25 | |
 | Scatter |
 | Special |
Epic Strike and Bonus Features
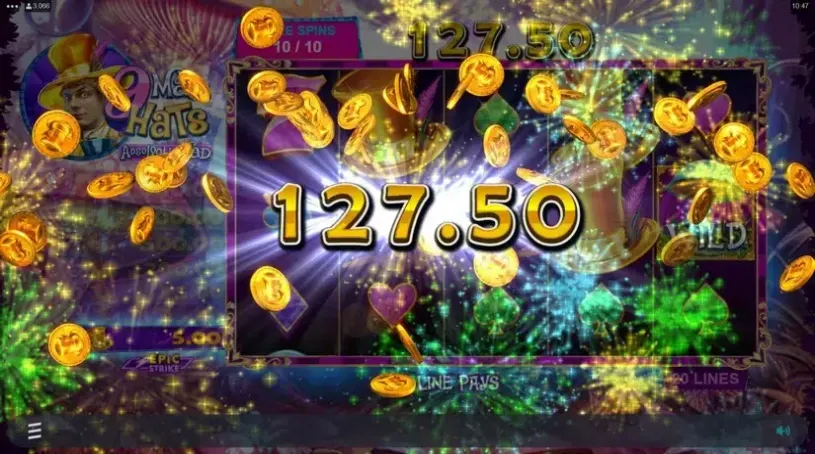
The primary draw is the Epic Strike feature, delivering instant cash prizes for landing 3 to 9 Golden Hat scatters anywhere in view. Cash values escalate non-linearly from 1x for three scatters up to the jackpot cap of 2,000x for nine. This mechanic is persistent, allowing for instant high-value wins during any phase of gameplay without requiring a bonus trigger. Since the max win is capped at the top Epic Strike prize, line wins serve primarily to sustain the session balance.
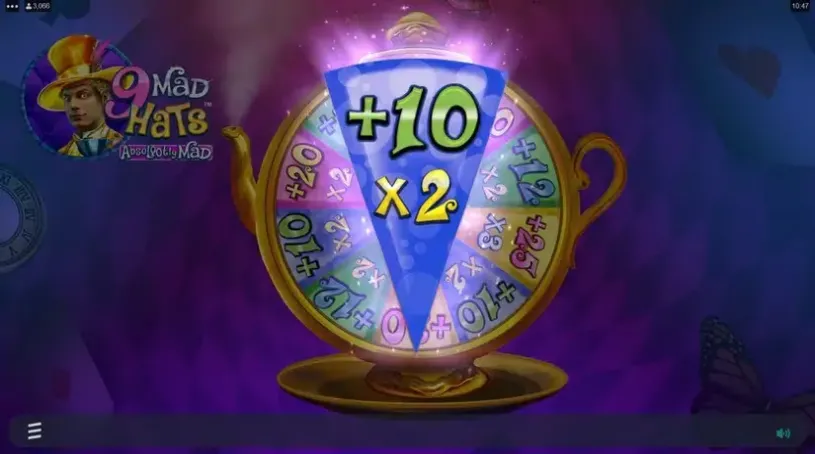
Three Free Spin scatters on the central reels initiate the bonus round. A Bonus Wheel determines the configuration, awarding between 10 and 20 spins with a x2 multiplier, or 25 to 30 spins with a x3 multiplier. It is statistically significant that this multiplier does not apply to Epic Strike prizes, affecting only standard payline combinations. The feature can be retriggered with the same number of spins as originally awarded to prolong the volatility curve.
While the wheel introduces a variable element, the mechanics remain deterministic regarding the separation of scatter wins and line multipliers. Players aiming for the 2,000x cap must rely on the Epic Strike scatters rather than the free spins multiplier. The bonus round hit frequency is standard for this math model, with the primary volatility driver being the scatter triggers rather than line hits.
In-Game Screenshots


9 Mad Hats FAQ
9 Mad Hats — Comparison
| Game | RTP | Volatility | Max Win | Rating |
|---|---|---|---|---|
| 96.24% | Average | x2000 | 7.5 | |
| 96.08% | Average | x5000 | ||
| 96.12% | High | x6300 | 9 | |
| 96.17% | 94.12% | 92.11% | 86.81% | Average | x9500 | 7.5 | |
| 96.20% | Average | x1300 | 7 | |
| 94.25% | Average | x1200 | 6.5 | |
| 96.40% | High | x10000 | 6 | |
| 96.40% | High | x10000 | 6 | |
| 96.40% | Low | x5200 | 7 | |
| 96.42% | High | x12000 | 6.5 | |
| 96.40% | High | x10000 | 6.5 | |
| 96.15% | Average | x2000 | 5 | |
| 95.86% | Average | x4000 | ||
| 92.23% | High | x18164 | 8 | |
| 95.98% | High | x5000 | ||
| 92.23% | High | x18720 | ||
| 95.98% | Average | x18164 | ||
| 96.01% | Average | x2000 | ||
| 96.08% | High | x12500 | ||
| 92% | Average | x360 | ||
| 96.19% | Average | x11750 | ||
| 96.02% | Average | x2343 | 7 | |
| 96.08% | High | x5000 | ||
| 96.52% | High | x5600 | ||
| 96.08% | Average | x2500 | ||
| 96.26% | High | x25000 |